RS Aggarwal Class 8 Solutions Chapter 21
RS Aggarwal Solutions for Class 8 Chapter 21 – Data Handling PDF
RS Aggarwal Class 8 Solutions Chapter-wise – Free PDF Download
Students can get the answers to RS Aggarwal Class 8 Solutions Chapter 21 Data Handling by Utopper. Here are the answers to all of the problems in RS Aggarwal Solutions for Class 8 Chapter 21. All the problems have been solved by math teachers who are experts. Every exercise has been set up in a way that makes it easy for the students to learn. The solutions to RS Aggarwal Class 8 Solutions Chapter 21 can be found in a PDF file that can be downloaded from our app.
The solutions are explained in as simple a way as possible so that you can fully understand them at once. Before they can do this, the students need to know a lot about data and what it means to handle data.
Utopper is a website where students can get free Reference Book Solutions and other study materials like Revision notes, Sample papers, and Important Question class 8. Science and Maths will be easier to learn if you have access to RS Aggarwal Class 8 Solutions and solutions for other courses.
Click Here – To Buy/Purchase RS Aggarwal Class 8 Solutions Online
RS Aggarwal Class 8 Solutions Chapter 21 – Data Handling
RS Aggarwal Class 8 Solutions
Chapter-1 Rational Numbers
Chapter-2 Exponents
Chapter-3 Squares and Square Roots
Chapter-4 Cubes and Cube Roots
Chapter-5 Playing with Numbers
Chapter-6 Operations on Algebraic Expressions
Chapter-7 Factorisation
Chapter-8 Linear Equations
Chapter-9 Percentage
Chapter-10 Profit and Loss
Chapter-11 Compound Interest
Chapter-12 Direct and Inverse Proportions
Chapter-13 Time and Work
Chapter-14 Polygons
Chapter-15 Quadrilaterals
Chapter-16 Parallelograms
Chapter-17 Construction of Quadrilaterals
Chapter-18 Area of a Trapezium and a Polygon
Chapter-19 Three-Dimensional Figures
Chapter-20 Volume and Surface Area of Solids
Chapter-21 Data Handling
Chapter-22 Constructing and Interpreting Bar Graphs
Chapter-23 Pie Charts
Chapter-24 Probability
Chapter-25 Graphs

An Overview of Data Handling
Data handling is an important part of RS Aggarwal Class 8 Solutions Math because it lays the groundwork for more difficult topics like statistics and probability. It is very important for students in class 8 to learn these chapters well. Some of the most important ideas that are talked about in this chapter are:
- Raw data is a type of information that is not organized.
- We should always set up data in a systematic way if we want to draw useful conclusions from it.
- Frequency means how many times a certain entry shows up.
- In a grouped frequency distribution, the raw data are put together in a way that makes sense.
- The histogram is a way to show grouped data.
- Histograms are a type of bar chart in which the horizontal axis shows the number of class intervals and the bars shows how often each class interval occurs.
- You can also show information with pie charts.
- Circle graphs are another name for pie charts.
- Random experiments are ones where the results cannot be predicted in advance.
- When each result of an experiment has the same chance of happening, these are equally likely results.
- The number of outcomes of an event divided by the total number of outcomes of the experiment gives the probability of an experiment.
- An event is the result of more than one experiment.
- Probability and chances are important in the real world.
What does Data mean?
Data is the information or facts that are collected through observations and measurements.
The real meaning of data can only be shown through examples: Let’s say your teacher gives the whole class a physics unit test. The next day, she gives out the grades, and you find out you got 8/10. Your best friend got an 8.5/10 as well. In the same way, everyone in the class got some marks. Data is the name for the grades you and your classmates got.
In math, we work with quantitative data, which is information that can be shown with numbers. Quantitative data is something like the grades you and your classmates got.
There are two kinds of data: “raw data” and “grouped data.”
- Raw Data: When the data is collected, it is not set up in a logical way. Instead, it is given in random order. This kind of data is called “raw data.”
- Grouped Data: When the raw data collected is put into groups in a methodical way, this is called “grouped data.”
What is Data Handling?
Data Handling means putting information in a way that makes sense. It involves gathering data, writing it down, analyzing it, and showing it in a way that helps people understand it and draw conclusions from it.
Most of the time, data is collected in a way that is not organized. This kind of information that isn’t put together is called “raw data.” In data handling, raw data is put together in a way that makes sense.
What does Frequency mean?
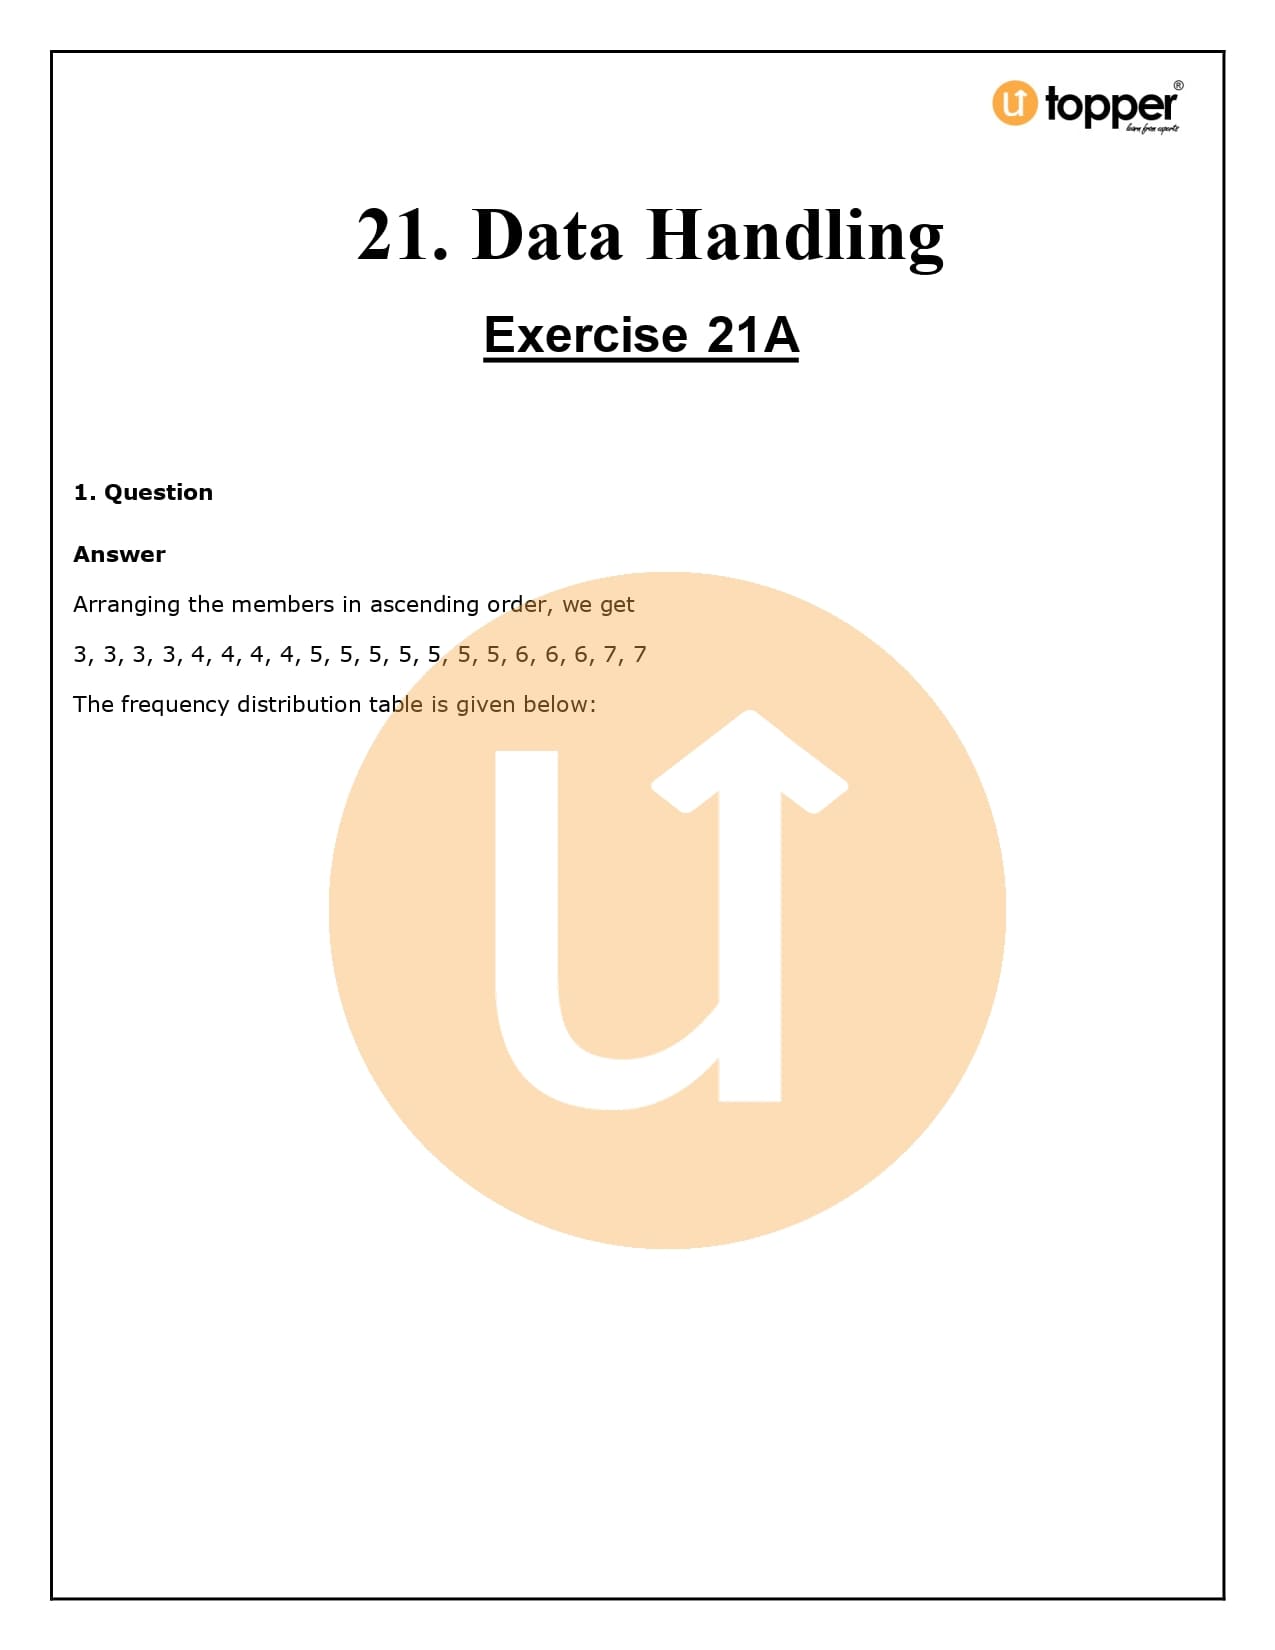
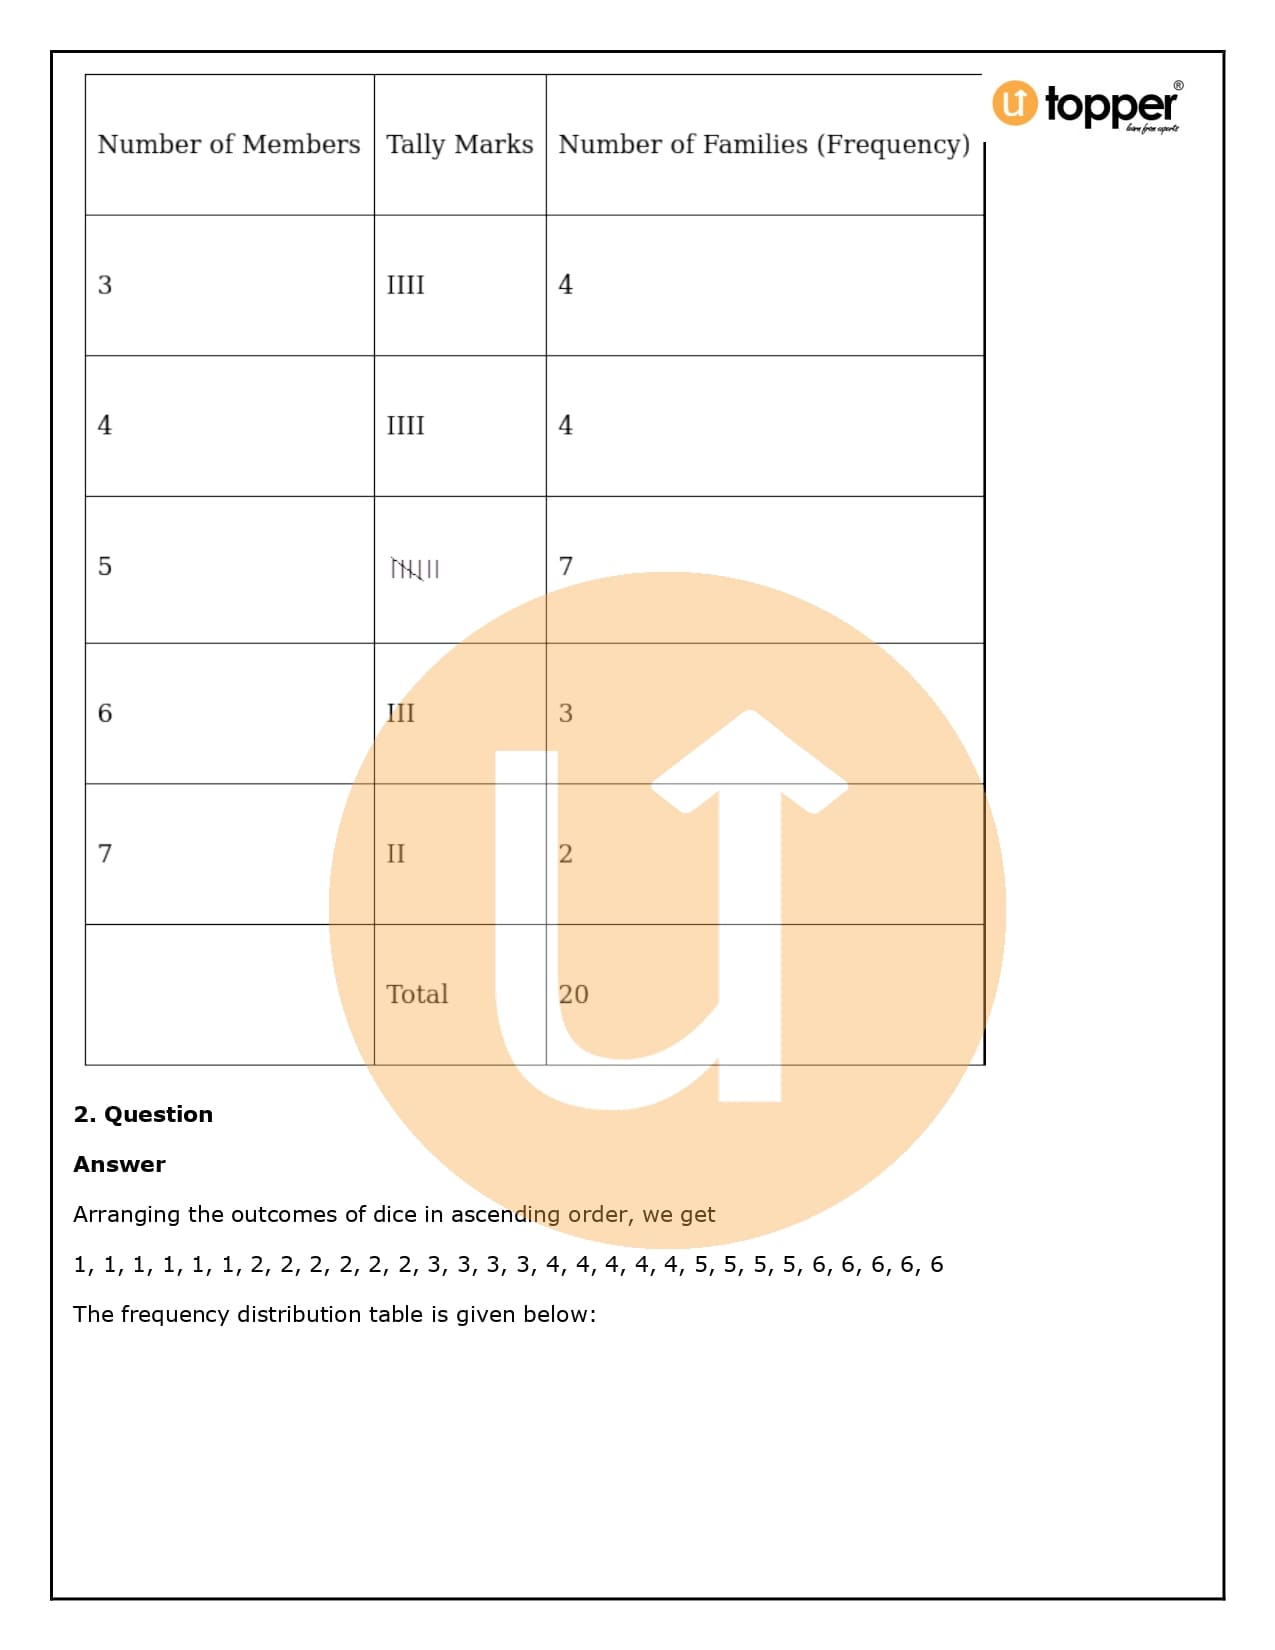
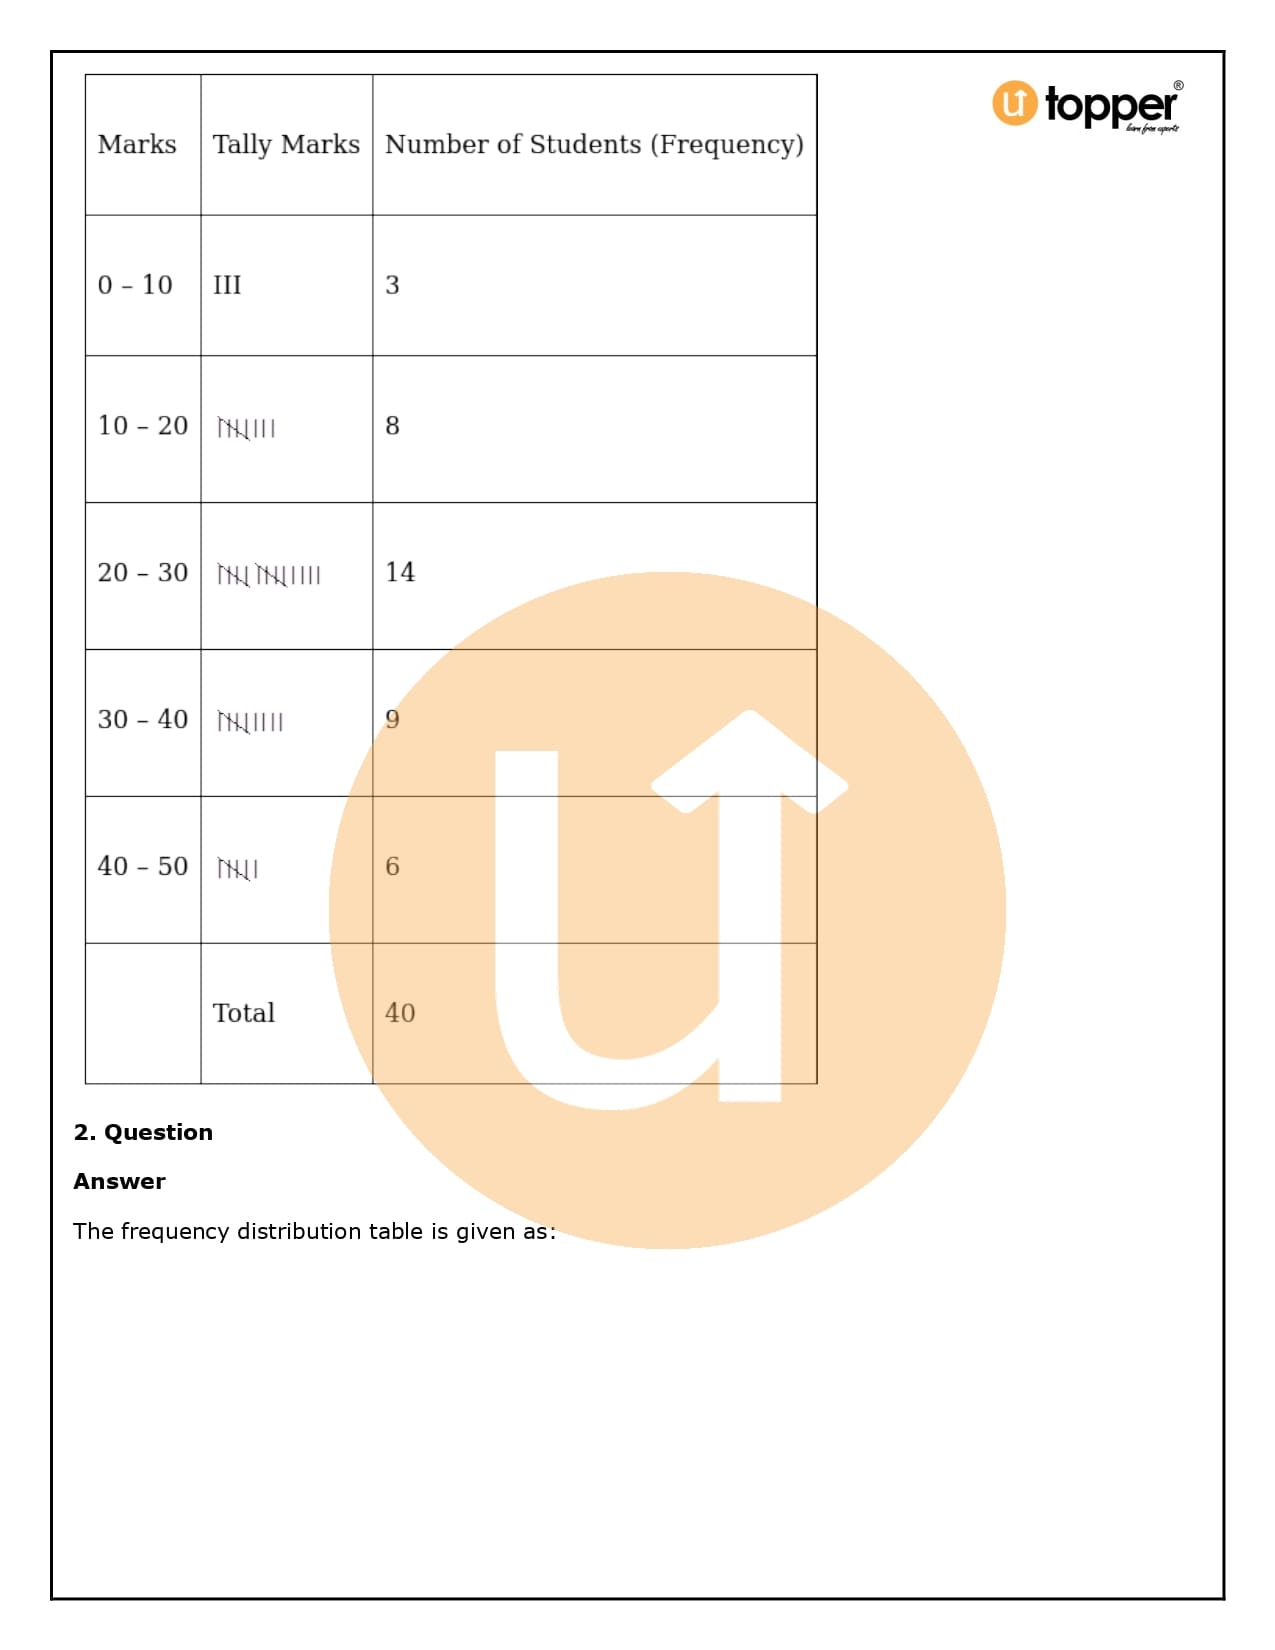
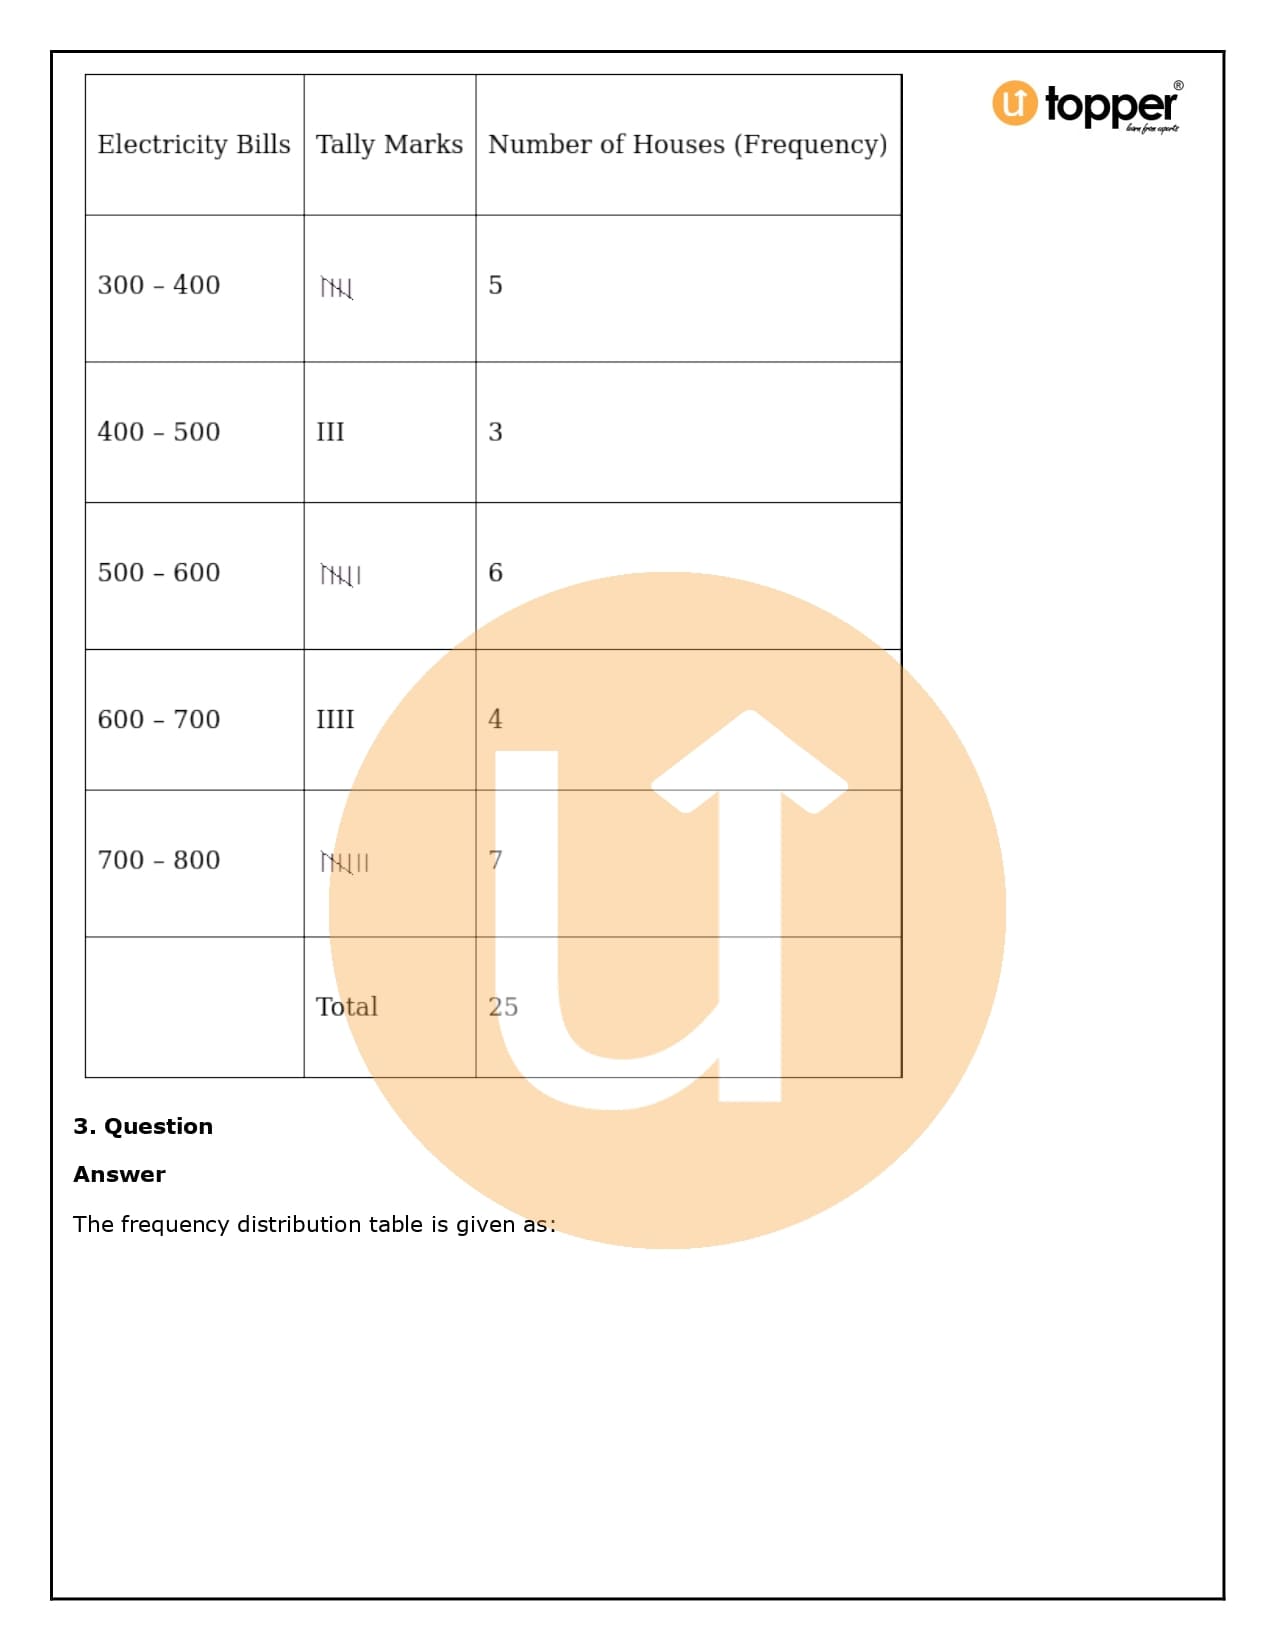
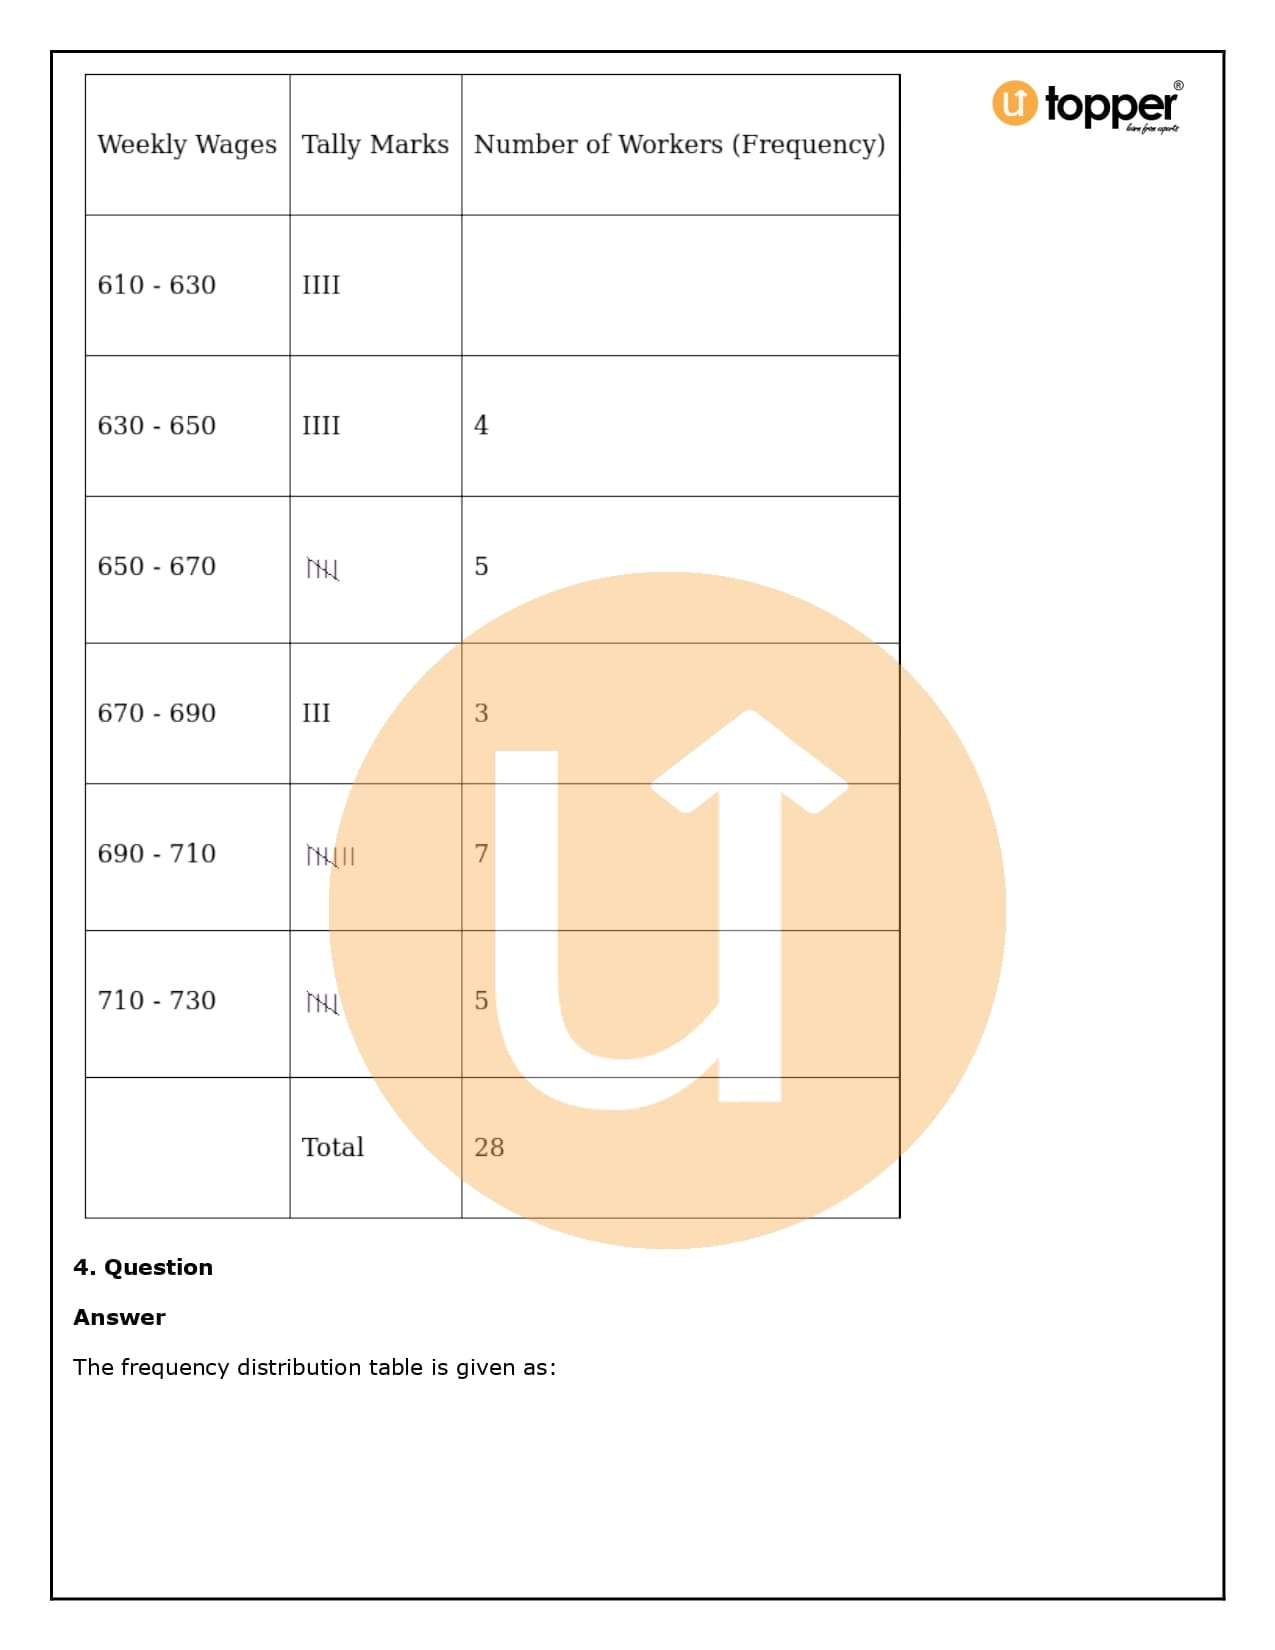
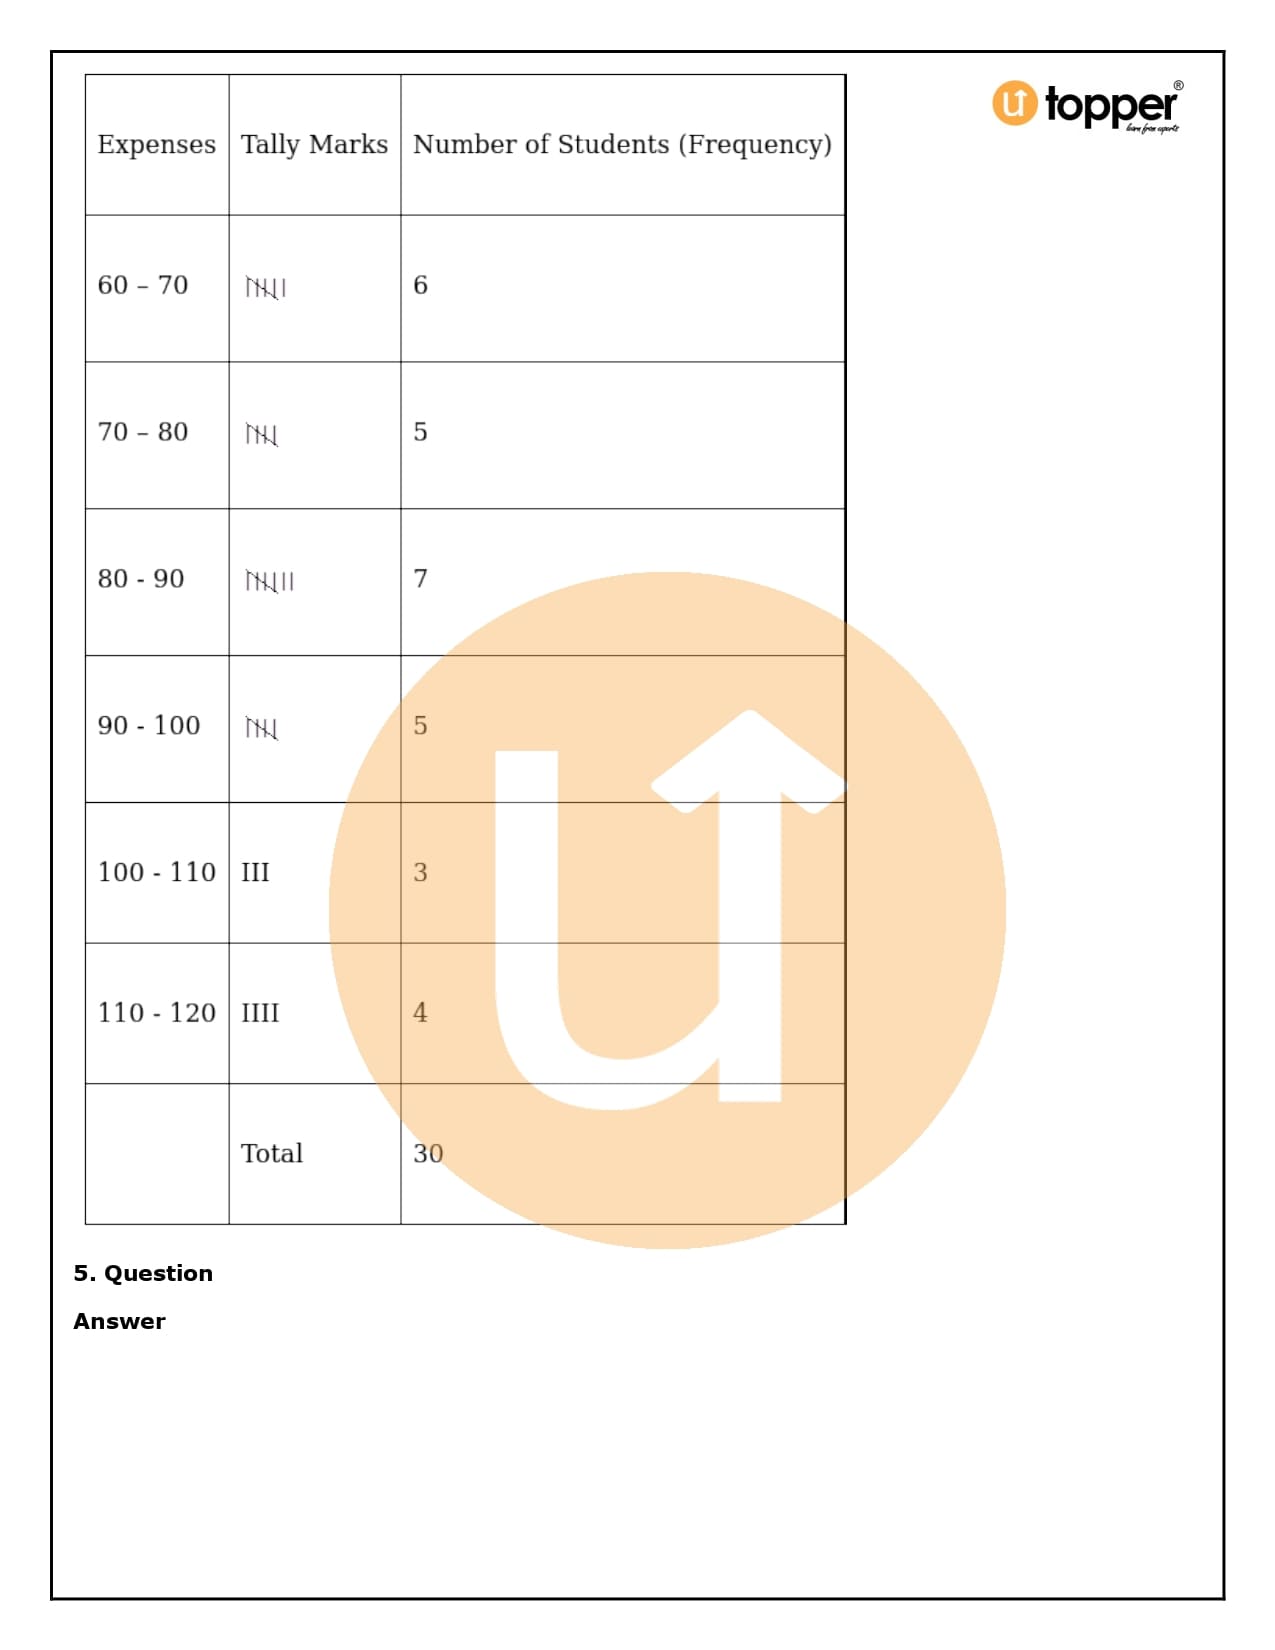
The number of times observation is made during a study is called its frequency. In the example above, three students like strawberry ice cream, so the frequency of strawberry ice cream is 4. In the same way, there are 5, 3, and 3 scoops of vanilla, chocolate, and another ice cream, respectively.
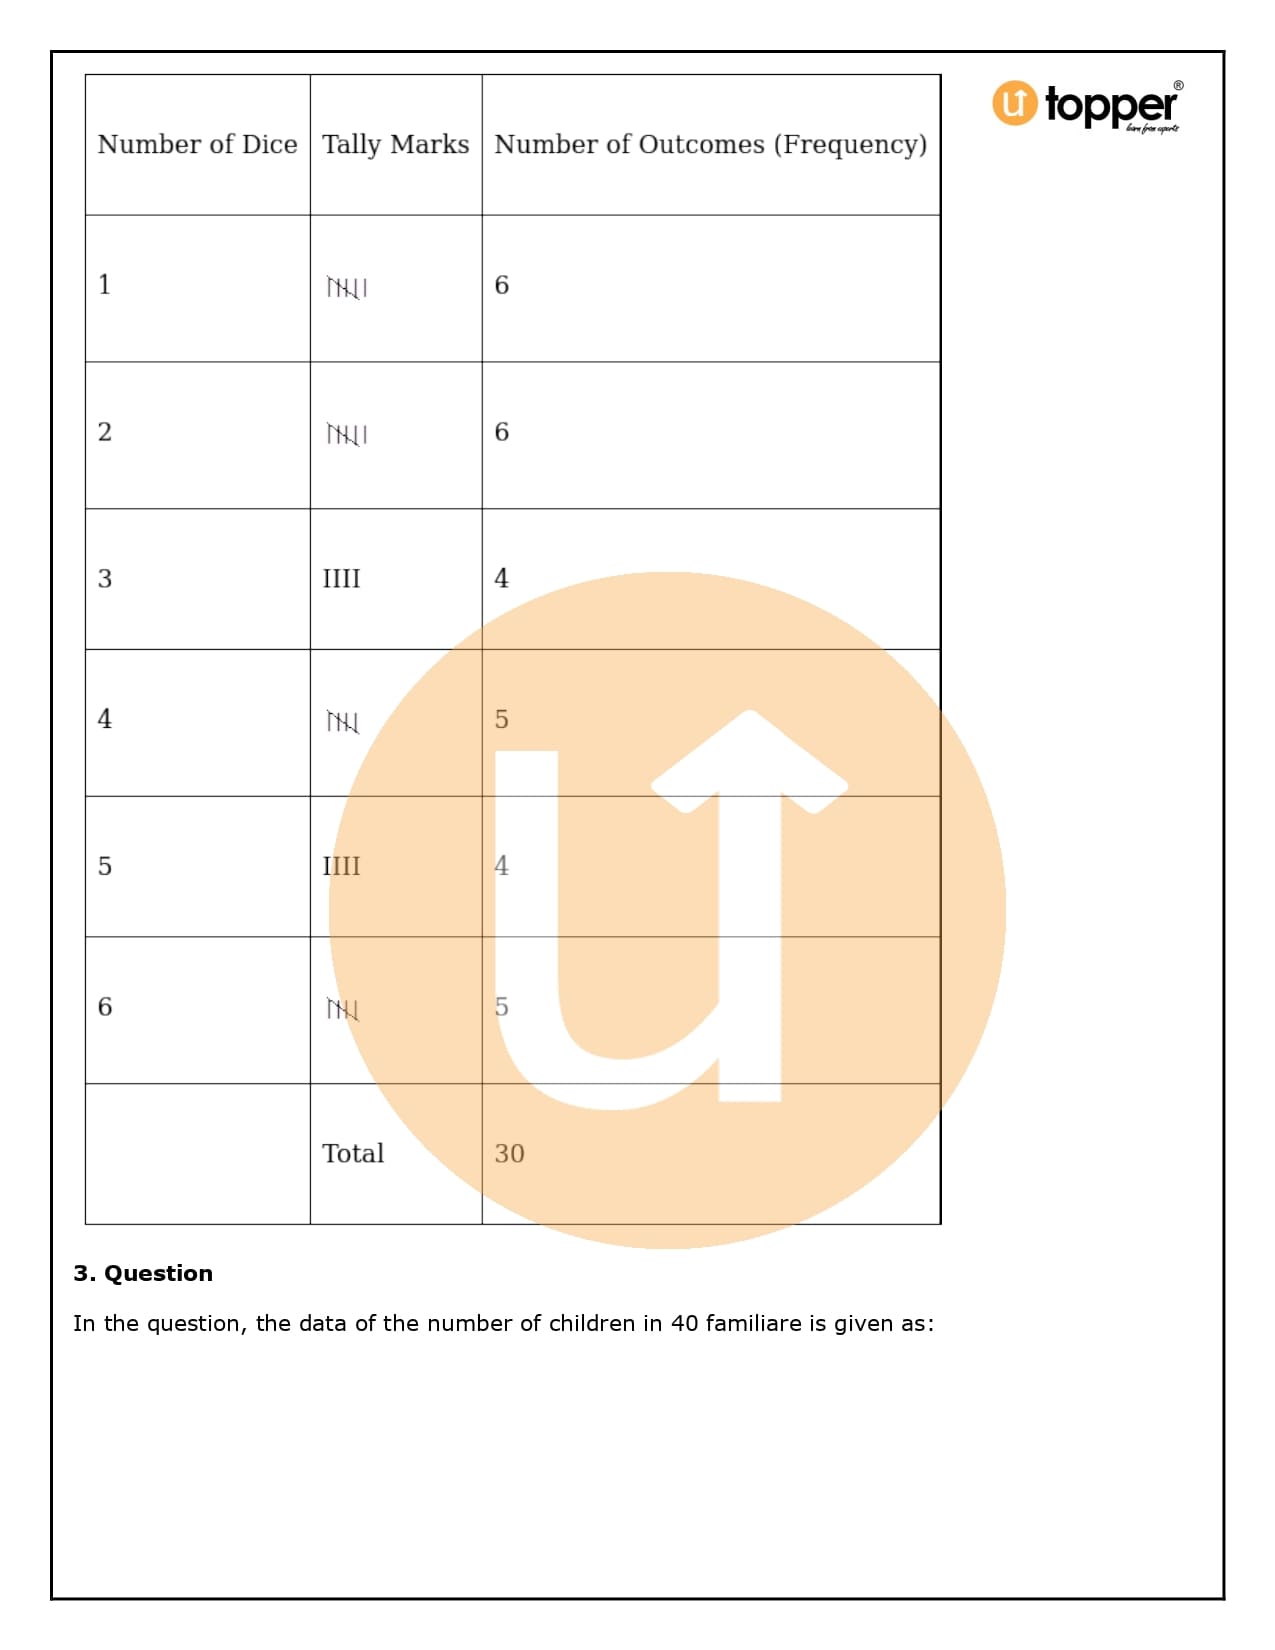
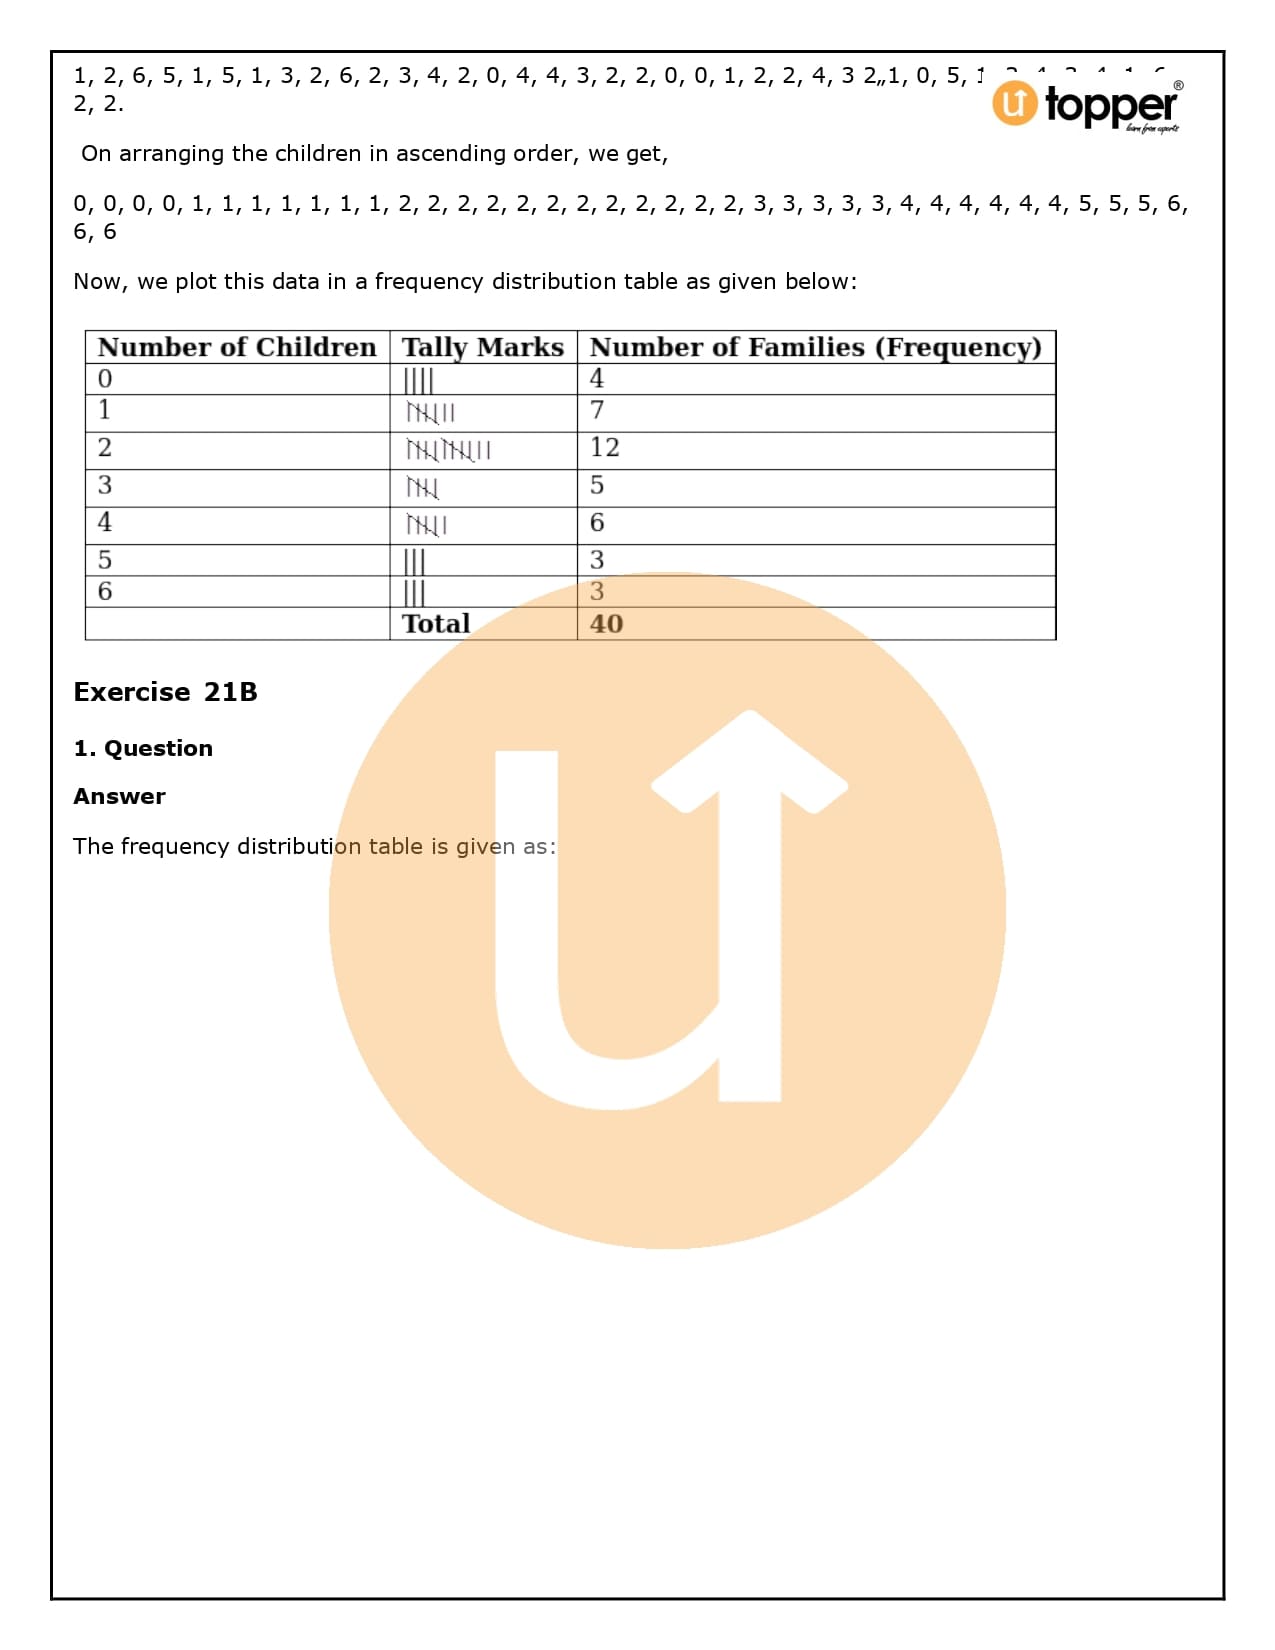
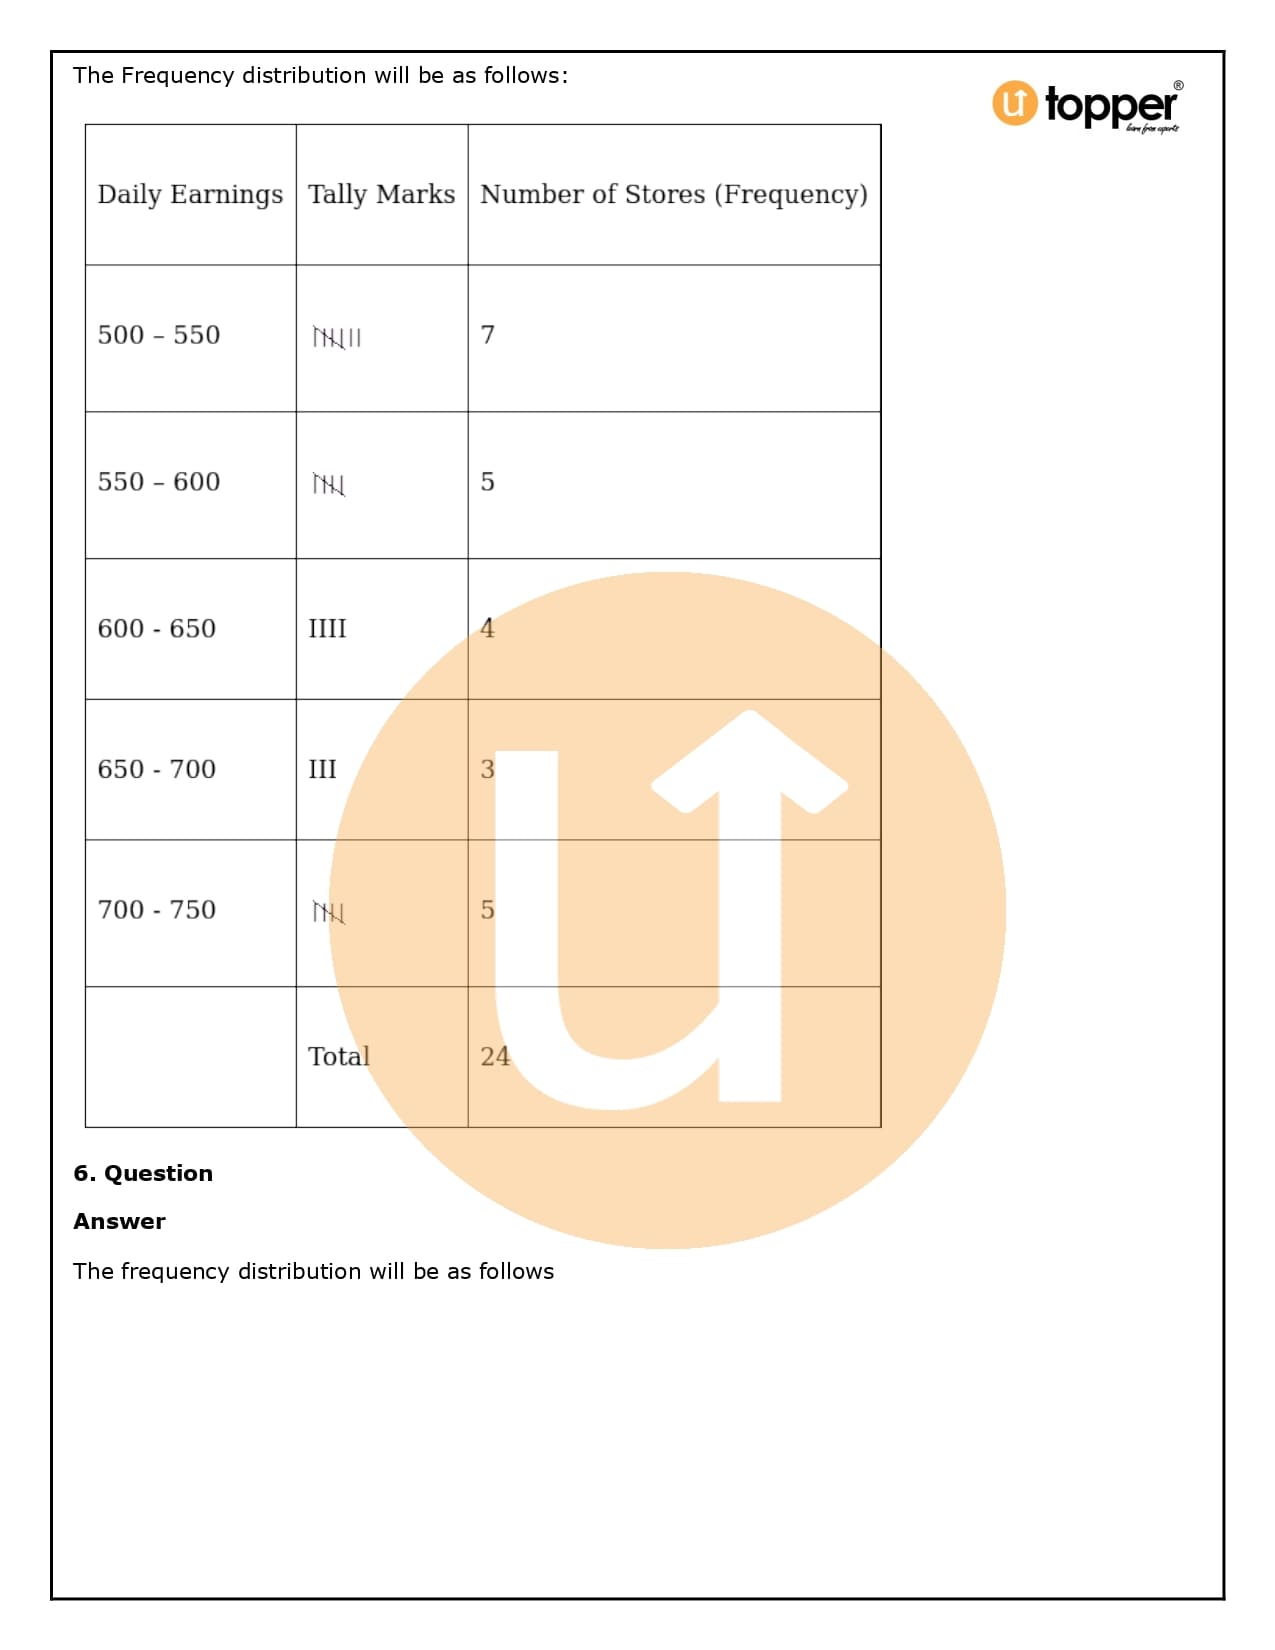
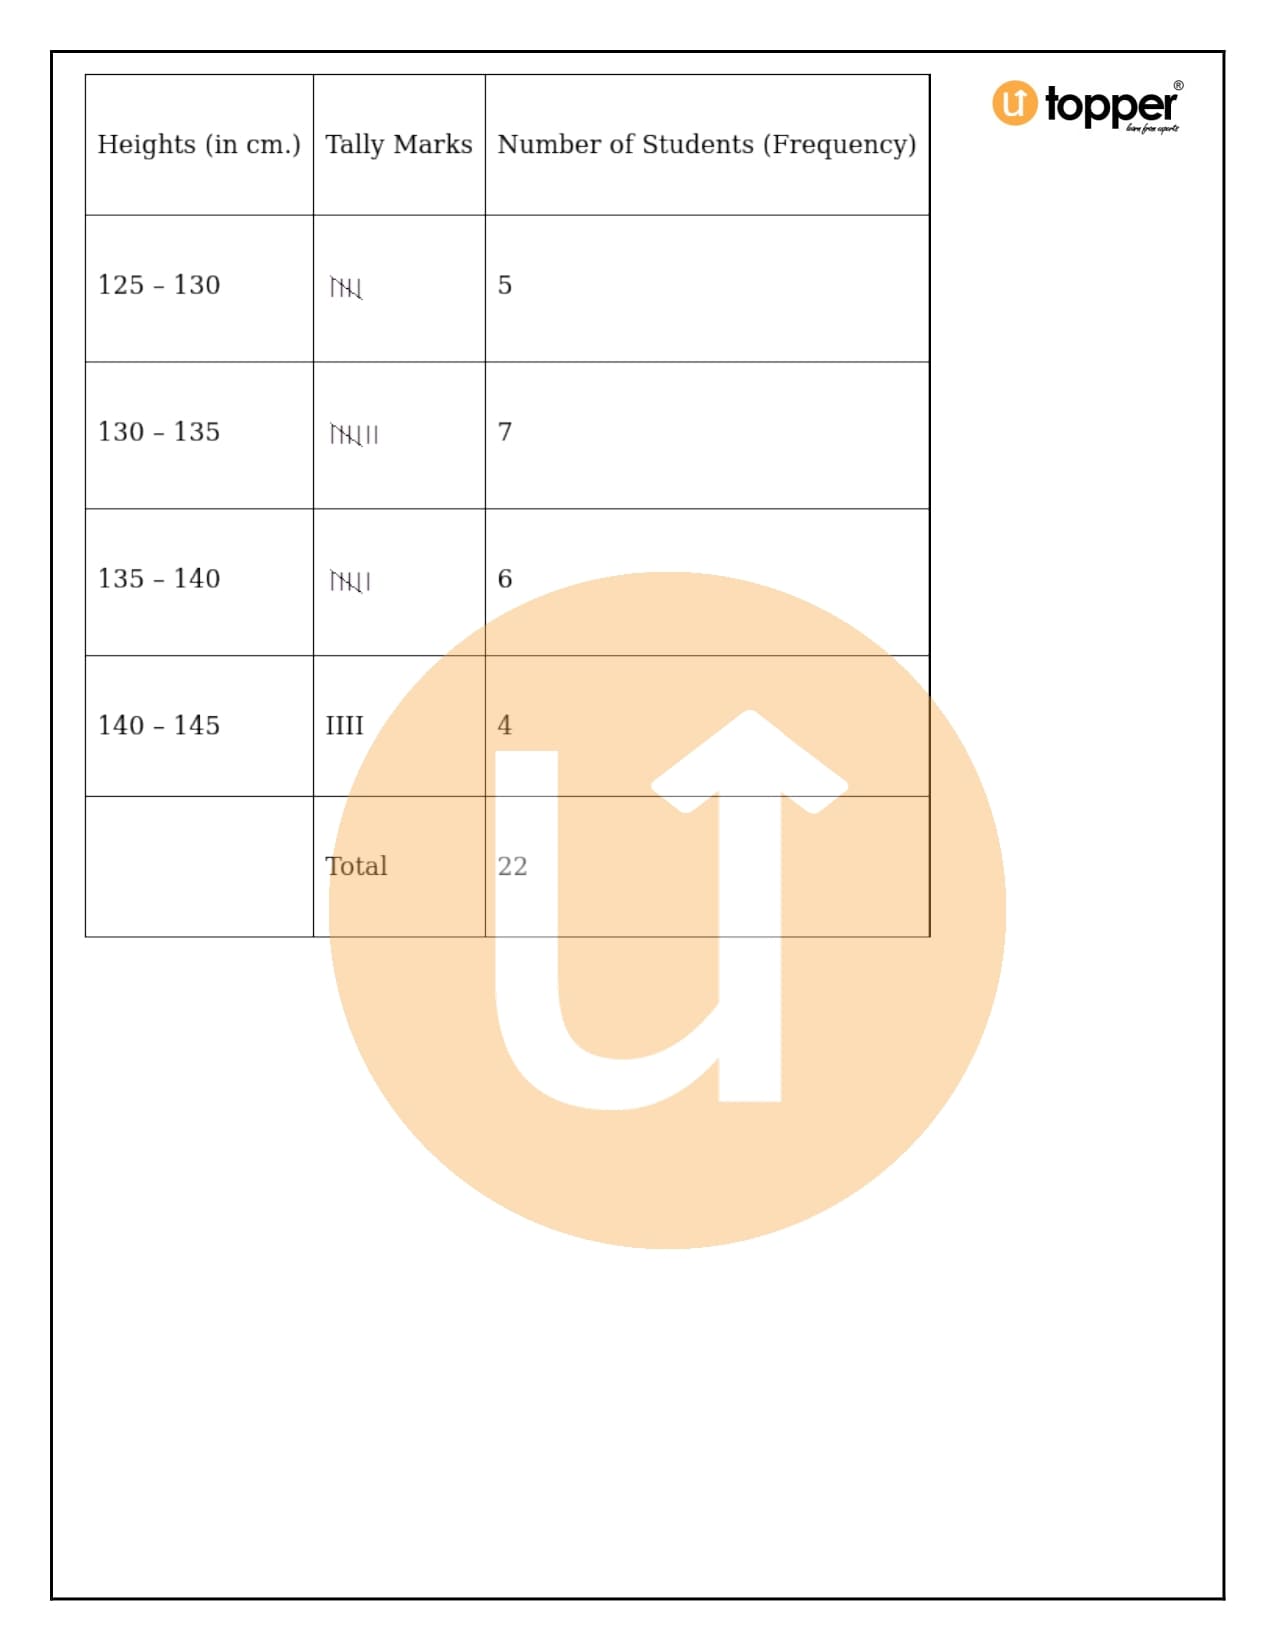
When we put the frequency of the data in a table, we have what is called a frequency distribution table.
What does “Class Interval” mean?
The range of each group of raw data is called the class interval. One example of a class interval is the range from 1 to 10, 11 to 20, and 21 to 30.
What are Pictographs?
A pictograph is a way to show information with the help of the right pictures. In a data presentation, each picture or symbol stands for a specific value.
What are Bar and Double Bar Graphs?
- Bar graphs are pictures that show data in the form of bars with the same width but different heights depending on the value of the data.
- A double bar graph shows two sets of information simultaneously in a bar graph. This kind of graph is used to compare the information.

FAQ ( Frequently Asked Questions )
1. What does Histogram mean? Is it the same as bar graphs?
Ans – A histogram is a type of graph that shows data by using bars of different heights. The frequency of each class interval is written along the vertical axis of the graph, and it is shown by the height of the bars. On the horizontal axis of the graph, the class intervals are written down.
Histograms and bar graphs may look alike, but there is a big difference between them. When making a histogram, there are no gaps between the bars because there are no gaps between class intervals. But in a bar graph, there are always equal gaps between each bar. Also, the width of the bars in a histogram can change, but the width of the bars in a bar graph stays the same.
2. Why Do We Collect Data?
Ans – In any field, collecting data is very important. This is because it helps us learn more about a subject, like how important it is and what its future looks like. It also helps people make better decisions by making it easier to make decisions based on data. It helps us figure out where we need to pay more attention. It also helps us improve the ways and methods we use for a particular case.
For example, if we want to do research on how well students are doing in math, we will collect information like how well students did in math in terms I and II from different classes. Data can be gathered for many different reasons, such as:
- For calculation
- For analysis of the data
- For making decisions
- To figure out what’s going on
3. What are the main things that RS Aggarwal Class 8 Solutions Chapter 21 is about?
Ans – In the RS Aggarwal Class 8 Solutions Chapter 21, which is called “Data Handling,” there are some of the most important ideas and topics in the chapter. Students can use the book to find questions on all of the significant topics. Most of the questions in this chapter are about smaller parts of data handling, such as
- Data
- Frequency
- Frequency Distribution Table
- Frequency distribution by groups
- Histograms are used to show data.
4. Where can I find helpful study materials for Class 8 Maths?
Ans – You can find everything on the Utopper app or website. The information in these resources is accurate and reliable because it is made by experts in the field. It’s easy for students to find important questions, revision notes, and more! There are no charges or fees for these study materials.
